
How to Calculate ROI for Mobile App Development in 2026
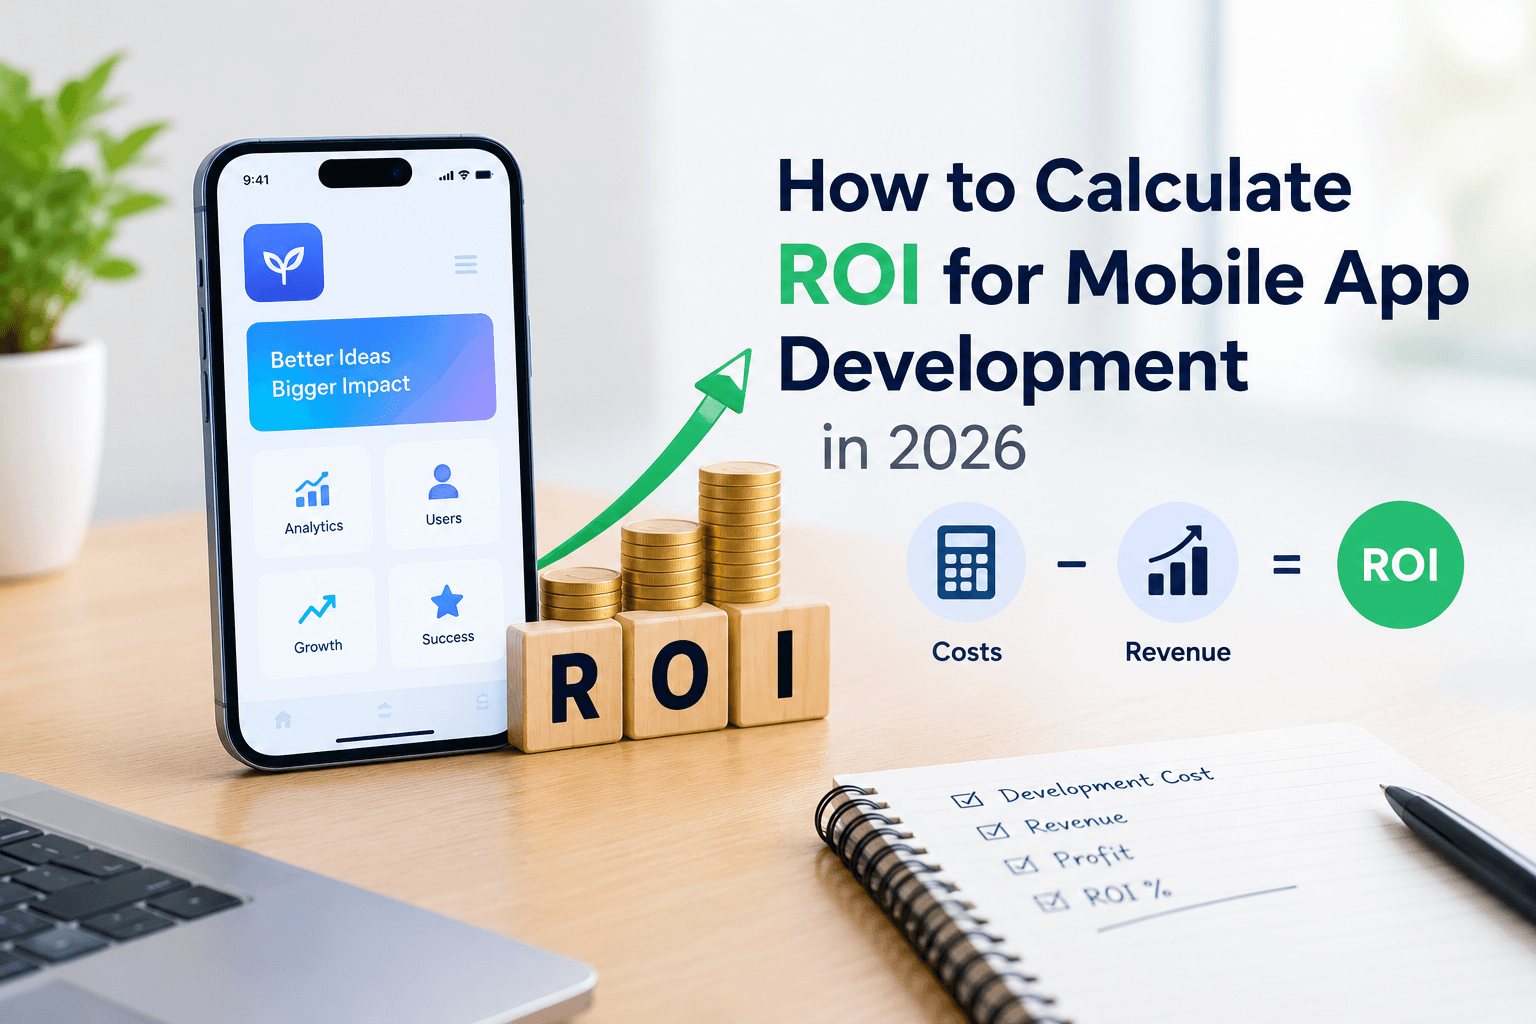
Most businesses can tell you what their app cost to build. Very few can tell you what it actually returned. That gap is why app budgets get cut after year one — not because the app failed, but because nobody measured whether it worked. This guide gives you the exact formula, the full cost-and-return checklist, and the 2026 benchmarks to calculate ROI with numbers a CFO will actually approve.
Quick Answer App ROI (%) = [(Total Returns − Total Investment) ÷ Total Investment] × 100 Total Investment = development + design + testing + marketing + maintenance. Total Returns = direct revenue (sales, subscriptions, ads) + indirect value (retention, cost savings, brand reach). A healthy app typically shows 20–50%+ ROI within 12–18 months of launch, though marketplace and fintech apps often take longer to break even. |
What Is App ROI and Why It Matters in 2026
Return on investment (ROI) for a mobile app measures the financial value the app generates against everything spent to design, build, launch, and run it. In 2026, that measurement matters more than ever: global mobile app development spending is projected to cross $206 billion, and rising customer acquisition costs mean an app can look busy — high downloads, decent reviews — while quietly losing money. ROI is the number that cuts through vanity metrics and tells you whether to scale the app, rebuild it, or shut it down.
The businesses that get burned are the ones that only track cost. They know the app was $45,000 to build, but they’ve never added up what it returned in sales, retained customers, or hours saved on support calls. ROI forces both sides of that ledger onto the same page.
The ROI Formula for Mobile Apps
The core formula is simple. The discipline is in what you plug into it.
ROI (%) = [(Total Returns − Total Investment) ÷ Total Investment] × 100
A second formula tells stakeholders when the app starts paying for itself — often the more persuasive number in a budget meeting:
Payback Period (months) = Total Investment ÷ (Annual Return ÷ 12)
Worked Example
Say a mid-complexity app costs $60,000 to design, build, and launch, plus $12,000 in first-year maintenance and $18,000 in launch marketing — a total investment of $90,000. In its first 12 months, it generates $70,000 in direct revenue (subscriptions and in-app purchases) plus an estimated $25,000 in value from reduced support-call volume and repeat purchases, for total returns of $95,000.
Metric | Value |
Total Investment | $90,000 |
Total Returns (Year 1) | $95,000 |
Net Profit | $5,000 |
ROI | 5.6% |
Payback Period | ≈ 11.4 months |
A 5.6% first-year ROI isn’t a failure — most apps don’t turn strong margins until year two, once acquisition costs are paid down and retained users compound in value. This is why measuring ROI only in month three or four gives a misleadingly negative picture.
Step-by-Step: How to Calculate Your App’s ROI
- Add up every cost. Development, UI/UX design, QA and testing, project management, third-party licenses and APIs, App Store/Play Store fees, launch marketing, and Year 1 maintenance (typically 15–20% of the original build cost).
- Add up every return. Direct revenue from sales, subscriptions, in-app purchases, and ads — plus indirect value like operational cost savings, customer retention lift, and reduced support overhead.
- Calculate net profit. Total Returns minus Total Investment.
- Apply the ROI formula. Divide net profit by total investment, multiply by 100.
- Calculate payback period. Total investment divided by monthly average return — this is the number that answers “when do we break even?”
- Re-measure at 6, 12, and 24 months. A single snapshot rarely reflects reality; apps compound in value as retained users and organic traffic build up.
What Counts as Your Total Investment (Full Cost Breakdown)
Under-counting cost is the single most common way ROI calculations get inflated. A complete investment figure includes every line below, not just the developer’s quote.
Complexity Tier | Typical Build Cost (2026) | What’s Included |
Basic / MVP | $15,000 – $40,000 | Single platform, core features, standard UI, minimal integrations |
Mid-Complexity | $40,000 – $100,000 | Cross-platform, custom UI/UX, payment gateway, API integrations, admin panel |
Advanced / Enterprise | $100,000 – $300,000+ | AI/ML features, real-time data, complex backend, high-security compliance, multi-platform scale |
On top of build cost, budget for these recurring line items — leaving any of them out is what makes a healthy-looking ROI collapse in year two:
- Annual maintenance and bug fixes: 15–20% of the original development cost
- App Store / Google Play developer fees and compliance updates
- Hosting, servers, and third-party API costs (scale with user volume)
- Ongoing user acquisition and retention marketing
- Security audits and compliance work, especially for fintech, health, or matrimony-category apps handling sensitive data
What Counts as Your Total Return
Return isn’t only the number on the invoice. Businesses that measure ROI narrowly — direct revenue only — routinely undersell their own app’s performance.
Return Type | Examples |
Direct Revenue | In-app purchases, subscriptions, ad revenue, e-commerce sales, transaction fees |
Efficiency Gains | Reduced call-center volume, faster order processing, lower manual data-entry cost |
Retention Value | Repeat purchase rate, subscription renewal revenue, reduced churn-related revenue loss |
Strategic / Brand Value | Higher brand visibility, improved customer trust scores, competitive differentiation |
Key Metrics That Actually Drive ROI
Two apps with identical build costs can produce wildly different ROI because of how efficiently they acquire and keep users. These four metrics explain most of that gap.
Metric | What It Tells You | Why It Moves ROI |
Customer Acquisition Cost (CAC) | Average spend to acquire one paying user | High CAC relative to LTV is the #1 reason apps show negative ROI in year one |
Customer Lifetime Value (LTV) | Total revenue expected from one user over their relationship with the app | LTV should exceed CAC by at least 3:1 for a sustainable app business |
Retention Rate | % of users still active after 30/90 days | Every retained cohort lowers your effective CAC over time |
ARPU (Average Revenue Per User) | Revenue ÷ active user count | Rising ARPU is often the fastest lever to push ROI positive without new spend |
5 Mistakes That Silently Skew Your ROI Numbers
- Measuring too early. ROI checked at month 2–3 almost always looks worse than it is — most apps need 9–18 months for retained users and organic traffic to compound.
- Ignoring maintenance cost. Skipping the 15–20% annual maintenance line is the single biggest reason projected ROI and actual ROI diverge.
- Counting downloads as returns. Downloads are a vanity metric — only activated, retained, or paying users represent real return.
- Leaving out indirect value. Support-cost reduction and retention lift are real dollars; excluding them makes a genuinely profitable app look like a loss.
- No baseline to compare against. ROI means little without knowing what the alternative — no app, a website-only strategy, or a competitor’s app — would have cost or returned.
How to Improve Your App’s ROI
- Launch an MVP first. Validating demand with a lean feature set before scaling reduces sunk cost if the concept needs to pivot.
- Fix retention before acquisition. It’s cheaper to keep an existing user than acquire a new one — prioritize onboarding and push-notification strategy before increasing ad spend.
- Track CAC and LTV monthly, not annually. Catching a rising CAC early prevents months of compounding losses.
- Invest in ASO before paid ads. Organic App Store visibility lowers blended CAC and keeps returning indefinitely, unlike paid campaigns.
- Treat security and performance as ROI levers, not just cost centers. Crashes, slow load times, and data breaches directly suppress retention and LTV.
Frequently Asked Questions
What is a good ROI for a mobile app in 2026?
Most healthy apps land between 20% and 50%+ ROI within 12–18 months of launch. Subscription and marketplace apps often start lower in year one because acquisition cost is front-loaded, then climb sharply as retained users compound.
How long does it take for a mobile app to become profitable?
Typically 9 to 18 months, depending on category. Utility and e-commerce apps with a direct sales path tend to break even faster than social or marketplace apps that need a critical mass of users before monetizing well.
Should I include maintenance costs in my ROI calculation?
Yes. Annual maintenance typically runs 15–20% of the original build cost, and leaving it out is the most common reason projected ROI is higher than actual ROI.
What’s the difference between ROI and payback period?
ROI measures the percentage return relative to what you spent. Payback period measures how many months it takes to earn back the initial investment. Both matter — ROI shows profitability, payback period shows how long your capital is tied up.
Can an app have a positive ROI without direct revenue?
Yes, if it’s built for efficiency rather than sales — for example, a service or logistics app that lowers support costs or manual labor. Value those savings in dollar terms and include them as returns in the formula.
Get best mobile app development services
Develop your business app
Conclusion
With 22+ years of experience and 550+ apps delivered, Mr Mobile App Developer builds cost breakdowns and revenue projections into every project scope from day one — so you know your expected ROI before development starts, not after. Book a free consultation to map your app’s budget, timeline, and realistic return.
Quality Service For You
We deliver unique and blended experiences to our customers across the globe. From idea to execution and launch, we do ALL.
Backend Development:
Table of Contents
Why Mobile Apps Fail After Launch: 15 Common Reasons and How to Prevent Them
How to Calculate ROI for Mobile App Development in 2026
Mobile App Development Lifecycle: Complete 2026 Guide (8 Stages)

Book your consultation now
Related Post